Predictive analytics and its applications in business intelligence forecasting are revolutionizing how companies make decisions. Forget relying on gut feelings – we’re diving deep into the world of data-driven predictions, exploring how businesses leverage advanced techniques to forecast trends, optimize operations, and ultimately, boost their bottom line. This isn’t just about crunching numbers; it’s about unlocking hidden insights and gaining a competitive edge in today’s rapidly evolving market.
From understanding the nuances of different predictive modeling techniques like regression analysis and machine learning algorithms to mastering data preparation and interpreting complex results, this exploration will equip you with the knowledge to navigate the exciting landscape of predictive analytics. We’ll uncover real-world applications across diverse industries, highlighting both the immense potential and the ethical considerations that come with harnessing the power of prediction.
Introduction to Predictive Analytics in Business Intelligence Forecasting
Predictive analytics is the process of using data, statistical algorithms, and machine learning techniques to identify the likelihood of future outcomes. In the realm of business intelligence, it acts as a powerful forecasting tool, enabling businesses to make data-driven decisions and gain a competitive edge. By analyzing historical data and identifying patterns, predictive analytics helps businesses anticipate future trends and prepare proactively.Predictive analytics differs significantly from descriptive and prescriptive analytics.
Descriptive analytics summarizes past data, providing insights into what has already happened. For instance, it might show sales figures for the last quarter. Predictive analytics, on the other hand, focuses on whatmight* happen in the future, using historical data to forecast future sales based on identified trends. Prescriptive analytics goes a step further, recommending actions to optimize outcomes based on the predictions generated by predictive analytics.
It might suggest specific marketing campaigns to boost predicted sales figures.
Key Differences Between Descriptive, Predictive, and Prescriptive Analytics
Descriptive analytics simply describes past events. It answers the question “What happened?”. For example, it might reveal that sales of a particular product were highest in the month of December last year. Predictive analytics uses this historical data (and other relevant data) to forecast future events. It answers the question “What might happen?”.
For example, it might predict that sales of the same product will increase by 15% in December of the coming year. Finally, prescriptive analytics uses the predictions to recommend actions to optimize outcomes. It answers the question “What should we do?”. It might suggest increasing inventory of that product in November to meet the predicted demand.
Benefits of Incorporating Predictive Analytics into Business Forecasting
Integrating predictive analytics into business forecasting offers numerous advantages. It significantly improves forecast accuracy, reducing reliance on gut feeling and intuition. By leveraging sophisticated algorithms, predictive models can identify subtle patterns and relationships in data that might be missed by human analysts. This leads to more reliable predictions, allowing businesses to make better-informed decisions regarding inventory management, resource allocation, and strategic planning.
For example, a retailer using predictive analytics might accurately predict a surge in demand for a particular item due to an upcoming holiday, ensuring sufficient stock to meet customer demand and avoid lost sales. Furthermore, predictive analytics enables proactive risk management. By identifying potential risks early on, businesses can take steps to mitigate them, minimizing potential losses and maximizing profitability.
For example, a financial institution might use predictive analytics to identify customers at high risk of defaulting on their loans, allowing them to take proactive measures to reduce their exposure to risk.
Data Sources and Preparation for Predictive Modeling
Predictive analytics relies heavily on the quality and quantity of data fed into the models. Gathering and preparing this data is a crucial, often time-consuming, step that significantly impacts the accuracy and reliability of forecasting. The process involves identifying relevant data sources, cleaning and transforming the data, and engineering new features to improve model performance. Let’s delve into the specifics.
Common Data Sources for Business Forecasting
Businesses possess a wealth of data that can be leveraged for predictive modeling. Common sources include Customer Relationship Management (CRM) systems, sales transaction records, market research reports, web analytics, social media data, and economic indicators. CRM systems provide insights into customer behavior, purchase history, and demographics. Sales data offers a direct measure of past performance, revealing trends and seasonality.
Market research provides external perspectives on consumer preferences and competitive landscapes. Web analytics tracks website traffic and user engagement, while social media data reflects public sentiment and brand perception. Finally, macroeconomic indicators, such as inflation rates and unemployment figures, can influence demand forecasting. The specific sources utilized will depend on the business context and the nature of the prediction being made.
For example, a retail company might primarily use sales data and CRM data, while a financial institution might incorporate economic indicators and market data.
Data Cleaning, Transformation, and Feature Engineering
Raw data is rarely ready for direct use in predictive models. It often contains inconsistencies, missing values, and irrelevant information. Data cleaning involves identifying and addressing these issues. This may include handling missing values (e.g., imputation or removal), correcting inconsistencies (e.g., standardizing formats), and removing duplicates. Data transformation involves converting data into a format suitable for modeling.
This could involve scaling numerical variables (e.g., standardization or normalization), encoding categorical variables (e.g., one-hot encoding or label encoding), and transforming skewed variables (e.g., logarithmic transformation). Feature engineering is the process of creating new features from existing ones to improve model performance. This might involve combining variables, creating interaction terms, or deriving new variables (e.g., calculating ratios or creating time lags).
For example, a retail company might engineer a new feature representing “average purchase value per customer” by dividing total spending by the number of purchases. This new feature could be a stronger predictor of future spending than the individual components alone.
Step-by-Step Guide to Data Preparation for Predictive Modeling
Effective data preparation is a systematic process. The following table Artikels the key steps, the types of data handled, and potential challenges encountered at each stage.
| Step | Data Types Handled | Process Description | Potential Challenges |
|---|---|---|---|
| Data Collection | All data types (numerical, categorical, textual, temporal) | Gathering data from various sources (CRM, sales data, market research, etc.). Ensuring data consistency and completeness across sources. | Data silos, inconsistent data formats, missing data across sources. |
| Data Cleaning | All data types | Handling missing values (imputation or removal), identifying and correcting outliers, removing duplicates, addressing inconsistencies in data formats. | Identifying and handling outliers, choosing appropriate imputation techniques, balancing bias removal with data loss. |
| Data Transformation | Numerical and categorical data | Scaling numerical variables (standardization, normalization), encoding categorical variables (one-hot encoding, label encoding), transforming skewed variables (logarithmic transformation). | Choosing appropriate scaling and encoding methods, dealing with high cardinality categorical variables. |
| Feature Engineering | All data types | Creating new features from existing ones (combining variables, creating interaction terms, deriving new variables). | Feature selection, avoiding overfitting, understanding the relationships between features. |
| Data Validation | All data types | Verifying data accuracy and consistency after cleaning, transformation, and feature engineering. | Ensuring data integrity, detecting and correcting errors introduced during the process. |
Predictive Modeling Techniques
Predictive modeling is the heart of business intelligence forecasting, leveraging historical data to anticipate future trends. Choosing the right technique depends heavily on the nature of the data and the specific business question being addressed. Different models offer varying strengths and weaknesses, making careful consideration crucial for effective forecasting. This section will explore several key techniques, comparing their capabilities and illustrating their application in real-world business scenarios.
Several techniques exist for building predictive models, each with its own strengths and weaknesses. The choice of technique depends heavily on the type of data available and the specific business problem being addressed. For example, time series analysis is ideal for forecasting sales trends over time, while regression analysis might be better suited for predicting customer churn based on various demographic and behavioral factors.
Machine learning algorithms offer a more flexible and powerful approach, capable of handling complex relationships and large datasets.
Regression Analysis
Regression analysis is a statistical method used to model the relationship between a dependent variable and one or more independent variables. In business forecasting, it’s often used to predict sales, demand, or customer behavior. For example, a retailer might use regression to predict future sales based on factors like advertising spend, seasonality, and economic indicators. Simple linear regression models a linear relationship between one independent and one dependent variable.
Multiple linear regression extends this to include multiple independent variables.
Time Series Analysis
Time series analysis focuses on data points collected over time. This is particularly useful for forecasting sales, stock prices, or other variables that exhibit trends and seasonality. Techniques like ARIMA (Autoregressive Integrated Moving Average) models are commonly used to capture these patterns. For instance, a company could use ARIMA to forecast its monthly revenue based on historical data, accounting for seasonal fluctuations and long-term trends.
Exponential smoothing methods, another type of time series analysis, are also popular for their simplicity and ability to adapt to changing trends. A retailer might use exponential smoothing to forecast daily demand for a particular product, adapting to fluctuations in consumer behavior.
Machine Learning Algorithms
Machine learning algorithms offer a powerful and flexible approach to predictive modeling. They can handle complex relationships and large datasets, often outperforming traditional statistical methods. Three commonly used algorithms are:
- Decision Trees: These algorithms create a tree-like structure to classify data or predict outcomes. They are easy to interpret and visualize, making them suitable for explaining predictions to stakeholders. A bank might use decision trees to predict loan defaults based on applicant characteristics. However, they can be prone to overfitting, especially with noisy data.
- Random Forests: This ensemble method combines multiple decision trees to improve accuracy and reduce overfitting. It’s robust to noisy data and can handle high-dimensional datasets. A marketing team might use random forests to predict customer response to a new marketing campaign, considering factors such as demographics, past purchase history, and website activity. However, the complexity of the model can make interpretation more challenging.
- Neural Networks: These algorithms are inspired by the structure of the human brain and are capable of learning complex patterns in data. They are particularly effective for handling non-linear relationships and large datasets. A telecommunications company might use neural networks to predict customer churn, taking into account various factors like usage patterns, customer service interactions, and billing history. However, they can be computationally expensive to train and require significant expertise to tune effectively.
The table below summarizes the strengths and weaknesses of these algorithms:
| Algorithm | Strengths | Weaknesses |
|---|---|---|
| Regression Analysis | Simple to understand and implement; provides interpretable results | Assumes linear relationships; sensitive to outliers; may not capture complex patterns |
| Time Series Analysis (ARIMA, Exponential Smoothing) | Effective for forecasting time-dependent data; captures trends and seasonality | Assumes stationarity (constant statistical properties) in some cases; may struggle with abrupt changes |
| Decision Trees | Easy to interpret and visualize; handles both categorical and numerical data | Prone to overfitting; can be unstable with small changes in data |
| Random Forests | High accuracy; robust to overfitting and noisy data; handles high-dimensional data | More complex to interpret than decision trees; computationally expensive |
| Neural Networks | High accuracy for complex patterns; handles non-linear relationships | Computationally expensive; requires expertise to train and tune; difficult to interpret |
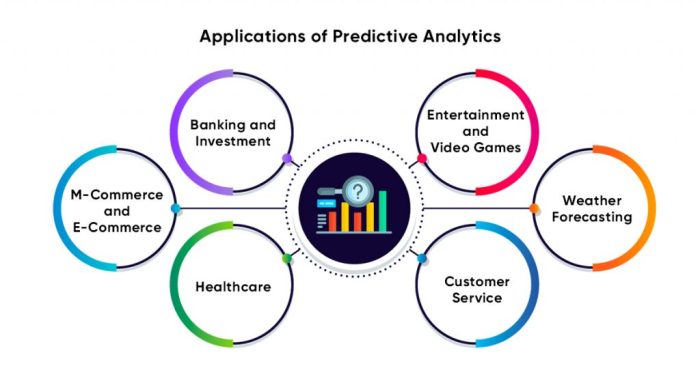
Applications of Predictive Analytics in Various Business Sectors
Predictive analytics, armed with its ability to forecast future trends and behaviors, is revolutionizing various business sectors. By leveraging historical data and sophisticated algorithms, businesses can make data-driven decisions, optimize operations, and gain a significant competitive edge. This section explores the diverse applications of predictive analytics across three key sectors: retail, finance, and healthcare, highlighting specific examples and ethical considerations.
Predictive Analytics in Retail
Retailers are harnessing the power of predictive analytics to enhance customer experience, optimize inventory management, and personalize marketing campaigns. For instance, Amazon utilizes predictive analytics to recommend products to its users based on their browsing history, purchase patterns, and interactions with the platform. This personalized approach significantly increases sales conversion rates. Furthermore, retailers employ predictive models to forecast demand, optimizing inventory levels and minimizing stockouts or overstocking, leading to cost savings and improved profitability.
Predictive analytics is revolutionizing business intelligence forecasting, allowing companies to anticipate market trends and optimize resource allocation. For example, understanding customer behavior during peak seasons like Black Friday is crucial, and savvy businesses leverage data-driven insights; check out this amazing deal on wpengine black friday to see how powerful this can be. Ultimately, accurate forecasting through predictive analytics leads to smarter decision-making and improved profitability.
Target’s infamous pregnancy prediction case, although controversial in its ethical implications (discussed below), showcases the power of predictive analytics in identifying and targeting specific customer segments with highly relevant offers.
Predictive Analytics in Finance
The finance industry heavily relies on predictive analytics for risk management, fraud detection, and algorithmic trading. Credit scoring models, for example, use predictive analytics to assess the creditworthiness of loan applicants, minimizing the risk of loan defaults. Banks and financial institutions also utilize predictive models to identify potentially fraudulent transactions in real-time, preventing financial losses and protecting customers.
In algorithmic trading, sophisticated predictive models analyze market data to identify profitable trading opportunities, executing trades automatically based on predicted price movements. This requires extremely high accuracy and speed. However, the complexity and speed of these systems also raise significant ethical questions regarding transparency and accountability.
Predictive Analytics in Healthcare, Predictive analytics and its applications in business intelligence forecasting
In healthcare, predictive analytics is transforming patient care, improving operational efficiency, and accelerating medical research. Hospitals use predictive models to identify patients at high risk of readmission, allowing for proactive interventions and improved patient outcomes. Predictive analytics can also assist in diagnosing diseases earlier and more accurately by analyzing patient data, including medical history, genetic information, and lifestyle factors.
Pharmaceutical companies utilize predictive modeling to identify potential drug candidates and optimize clinical trials, accelerating the drug development process. The ethical considerations here center around data privacy, algorithmic bias, and the potential for discriminatory outcomes based on patient demographics or socioeconomic status.
Hypothetical Case Study: Predictive Maintenance in Manufacturing
Imagine a large manufacturing plant producing automotive parts. The plant experiences frequent equipment failures, leading to production downtime and increased maintenance costs. By implementing predictive analytics, the plant aims to optimize its maintenance schedule and minimize downtime.Data Used: Historical data on equipment performance, including sensor readings (temperature, vibration, pressure), maintenance logs, and production output.Model Selection: A machine learning model, specifically a recurrent neural network (RNN) or a long short-term memory (LSTM) network, is chosen due to its ability to handle time-series data and identify patterns indicative of impending equipment failures.Expected Outcomes: The predictive model identifies equipment components likely to fail within a specific timeframe.
This allows for proactive maintenance, reducing unplanned downtime by 20%, minimizing repair costs by 15%, and increasing overall production efficiency by 10%. The model’s accuracy is continuously monitored and improved through feedback loops. This is a realistic outcome based on real-world applications of predictive maintenance in various industries.
Evaluating Predictive Models and Performance Metrics
Building accurate predictive models is crucial for effective business forecasting. However, simply building a model isn’t enough; rigorous evaluation and validation are essential to ensure its reliability and usefulness in making informed business decisions. Without proper evaluation, a seemingly impressive model might be delivering inaccurate predictions, leading to flawed strategies and wasted resources. This section delves into the key performance indicators (KPIs) used to assess predictive model performance and how to interpret the results.Understanding the performance of a predictive model requires a nuanced approach.
We need to go beyond simply looking at overall accuracy and delve into more specific metrics that reveal the strengths and weaknesses of the model in different aspects of prediction. This allows for a more comprehensive understanding of the model’s reliability and helps in making informed decisions regarding its deployment and further refinement. By analyzing these KPIs, businesses can gain valuable insights into their model’s performance, leading to better decision-making and improved business outcomes.
Key Performance Indicators (KPIs) for Predictive Model Evaluation
Several key performance indicators are crucial for evaluating the effectiveness of predictive models. These metrics provide a quantitative assessment of the model’s accuracy, precision, and recall, allowing for a comprehensive understanding of its performance. The choice of KPIs depends on the specific business problem and the relative importance of different types of prediction errors (false positives vs. false negatives).
- Accuracy: This measures the overall correctness of the model’s predictions. It’s calculated as the ratio of correctly predicted instances to the total number of instances. For example, if a model correctly predicts 90 out of 100 customer churn cases, its accuracy is 90%. While seemingly straightforward, accuracy can be misleading if the classes are imbalanced (e.g., far more non-churners than churners).
- Precision: Precision focuses on the accuracy of positive predictions. It answers the question: “Of all the instances predicted as positive, what proportion were actually positive?” A high precision score indicates that the model rarely makes false positive predictions. For instance, in fraud detection, high precision is crucial to minimize false alarms.
- Recall (Sensitivity): Recall measures the model’s ability to identify all positive instances. It answers: “Of all the actual positive instances, what proportion did the model correctly identify?” High recall is important when missing positive instances is costly (e.g., failing to identify potentially at-risk customers).
- F1-Score: The F1-score is the harmonic mean of precision and recall, providing a balanced measure of both. It’s particularly useful when dealing with imbalanced datasets, as it considers both false positives and false negatives. A high F1-score indicates a good balance between precision and recall.
- AUC (Area Under the ROC Curve): The ROC curve plots the true positive rate against the false positive rate at various classification thresholds. The AUC summarizes the ROC curve, representing the probability that the model will rank a randomly chosen positive instance higher than a randomly chosen negative instance. A higher AUC (closer to 1) indicates better model performance. For example, an AUC of 0.9 indicates that the model is highly effective at distinguishing between positive and negative instances.
Interpreting Model Evaluation Metrics and Decision Making
Interpreting these metrics involves a careful consideration of the business context. For example, in a customer churn prediction model, a high recall might be prioritized to ensure that all at-risk customers are identified, even if it means accepting a slightly lower precision (some false positives). Conversely, in a fraud detection system, high precision is paramount to minimize false alarms, even if it means missing some fraudulent transactions (lower recall).
The optimal balance between precision and recall depends on the specific costs associated with false positives and false negatives in the given business scenario. For instance, a bank might prioritize precision in fraud detection to avoid wrongly accusing customers, whereas a marketing campaign might prioritize recall to ensure that all potential customers are reached. The chosen KPIs and their interpretation will directly inform decisions about model deployment, refinement, or further model exploration.
Visualizing and Communicating Forecasting Results: Predictive Analytics And Its Applications In Business Intelligence Forecasting
Data visualization is crucial in predictive analytics. Effectively communicating complex forecasting data to diverse audiences—from executive teams to operational managers—requires choosing the right visualization methods and tailoring the presentation to their specific needs and understanding. Poorly presented data, no matter how accurate the predictions, can lead to misinterpretations and ineffective decision-making.Effective visualization transforms raw data into easily digestible insights, highlighting key trends, patterns, and potential risks or opportunities.
This section explores best practices and examples of different visualization techniques to ensure your forecasting results are understood and acted upon.
Dashboard Design for Key Forecasting Metrics
A well-designed dashboard provides a concise overview of critical forecasting metrics. Consider a dashboard for a retail company forecasting sales. The dashboard should present key performance indicators (KPIs) in a clear, visually appealing manner, enabling quick identification of trends and potential issues.Imagine a dashboard divided into four quadrants. The top-left quadrant displays a line chart showing projected sales for the next 12 months, compared to actual sales from the previous 12 months.
This allows for easy identification of growth or decline trends. The top-right quadrant features a bar chart comparing projected sales across different product categories, highlighting potential best-sellers and underperformers. The bottom-left quadrant uses a geographical heatmap to illustrate projected sales performance across different regions, identifying areas requiring focused attention or resource allocation. Finally, the bottom-right quadrant presents a key metric—projected profit margin—with a clear indication of whether it meets or exceeds the target.
Color-coding and clear labeling are used throughout to enhance readability and understanding. For example, exceeding the target profit margin might be indicated by green, while falling short might be represented in red.
Utilizing Line Charts for Trend Analysis
Line charts are ideal for showcasing trends over time. For instance, a line chart can effectively display projected monthly website traffic over the next year, allowing stakeholders to anticipate potential increases or decreases in website activity. Multiple lines can be overlaid to compare different scenarios (e.g., projected traffic under different marketing campaign strategies). Clear labeling of axes and data points is essential, and a legend is necessary if multiple lines are used.
The use of distinct colors for different lines improves clarity and readability. A notable example would be tracking the number of online orders over a year, comparing projections with actual results.
Employing Bar Charts for Comparisons
Bar charts are effective for comparing different categories or groups. A bar chart could display projected sales for various product lines, allowing for easy comparison of performance across different products. Stacked bar charts can be used to show the breakdown of sales within each product line by region or customer segment. Using distinct colors for each category and clear labels ensures easy interpretation.
For instance, comparing projected market share across competing brands in a particular industry provides a clear visual representation of competitive landscape.
Leveraging Heatmaps for Geographic Data
Heatmaps are particularly useful for visualizing geographical data. A heatmap could display projected sales performance across different regions, highlighting areas of high and low sales. Different color intensities can represent different levels of sales, making it easy to identify high-performing and underperforming regions. This allows for quick identification of areas needing attention or resource allocation. For example, a retail chain could use a heatmap to visually represent projected sales for each store location, making it easy to identify locations that are expected to underperform.
Future Trends and Challenges in Predictive Analytics for Business Intelligence
Predictive analytics is rapidly evolving, driven by advancements in technology and the ever-increasing volume of data available to businesses. This evolution presents exciting opportunities but also significant challenges for organizations seeking to leverage its power for effective business intelligence forecasting. Understanding these trends and challenges is crucial for successful implementation and sustained competitive advantage.The landscape of predictive analytics is constantly shifting, influenced by breakthroughs in machine learning, the rise of big data, and the growing sophistication of business needs.
These factors are reshaping how businesses approach forecasting and decision-making, leading to both innovative applications and new hurdles to overcome.
Emerging Trends in Predictive Analytics
Several key trends are shaping the future of predictive analytics. These advancements promise to significantly enhance the accuracy, speed, and applicability of business forecasting. For example, the integration of Artificial Intelligence (AI) and Machine Learning (ML) is transforming predictive modeling, allowing for the analysis of far more complex datasets and the identification of previously unseen patterns. The rise of cloud computing provides scalable and cost-effective solutions for handling large volumes of data, while the increasing availability of real-time data streams allows for more dynamic and responsive forecasting.
Challenges in Implementing and Maintaining Predictive Analytics Systems
Despite the potential benefits, implementing and maintaining predictive analytics systems presents considerable challenges. Data quality remains a major concern; inaccurate or incomplete data can lead to flawed predictions. The need for specialized skills and expertise in data science, machine learning, and statistical modeling also poses a significant hurdle for many organizations. Furthermore, integrating predictive analytics systems with existing business processes and ensuring data security and privacy are critical considerations that require careful planning and execution.
For instance, a retail company might struggle to integrate a new predictive model for inventory management with its existing legacy systems, leading to delays and inefficiencies.
Impact of Increasing Data Volume and Complexity
The exponential growth in data volume and complexity is both a blessing and a curse for business intelligence forecasting. While it provides richer datasets for more accurate predictions, it also increases the computational demands and the complexity of data management. This necessitates the adoption of advanced data processing techniques and more powerful computing infrastructure. Moreover, effectively managing and interpreting the vast amounts of unstructured data, such as social media posts and customer reviews, requires sophisticated natural language processing (NLP) and sentiment analysis techniques.
Consider the example of a financial institution; the sheer volume of transaction data, coupled with the need to analyze diverse data sources like news articles and social media sentiment, requires robust and scalable analytics infrastructure to identify potential risks and opportunities accurately.